Member/Partner News
Solargis releases annual and monthly difference maps for free
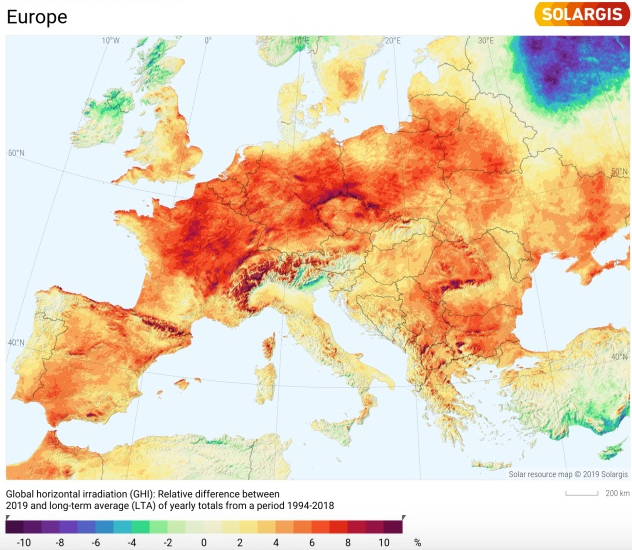
Solargis has decided to release regional maps that show the % deviation in solar radiation from the long-term average. The variability in solar radiation is caused mainly by the changes in cloud formations and the concentration of aerosols in the atmosphere. These maps are basic tools to understand and evaluate the performance of your solar plants.
- Maps showing annual deviation for 2019 are available for direct download.
- Monthly maps are available as a free email subscription service
Receive the maps in your inbox each month by subscribing at https://solargis.com/products/monitor/solar-performance-maps